
Why the tech adoption curve matters to founders, operators and investors in 2026
In 2026, understanding how new ideas and products spread is super important for anyone involved in startups. This is where the tech adoption curve comes in. It helps founders, people running companies, and investors see where a new technology stands in the market.

Knowing this can change everything about how a company grows and how it gets money.
Think about it this way: if you’re a founder with a cool new applied tech idea, you need to know if it’s too early, just right, or maybe even a bit late for your audience. Investors also want clear signals. They need to know if people are ready to use this new tech and if it has a good chance to grow. This helps them decide if and when to put money into your company. Without clear signals, it’s like trying to find your way in the dark.
The tech adoption curve shows how different groups of people accept new things over time. It starts with innovators, then early adopters, and so on, creating a special S-shaped growth pattern for new ideas and products Diffusion of Innovations Curve (Rogers). Models like the Bass diffusion model help forecast how quickly a new product will be picked up by many people The Bass Diffusion Model. These tools are key to making smart choices about your go-to-market plans.
This article will help you understand these important models better. We will look at real market signals, learn how investors think, and explore tools to predict the future. We will also share practical steps for getting money for your startup at every stage of the adoption journey. Whether you’re a founder or an investor, having a clear view of the tech adoption curve can unlock big opportunities.
For more insights into the broader tech market that shapes these trends, check out The AI Newsletter Worth Reading. It gives clear daily AI updates to help you stay ahead. You might also find it helpful to learn about Mapping the Tech Domain for Founder and Investor Success 2026 to deepen your understanding.
Understanding the Modern Tech Adoption Curve: Models and frameworks
The tech adoption curve is not a single, simple idea. Many smart people have created models to help us understand how new ideas and products spread. These models are crucial for anyone dealing with applied tech or looking for funding in 2026.
One of the most well-known models is Everett Rogers’ Diffusion of Innovations theory. This theory explains how new ideas move through society. It divides people into five groups based on when they try something new Diffusion of Innovations – TheoryHub:
- Innovators: These are the brave souls who are first to try new things. They love new tech and taking risks.
- Early Adopters: These people are leaders in their community. They are eager to try new things but are also careful about what they choose. They are key because others often look to them for advice.
- Early Majority: This group is thoughtful. They wait to see if a new tech is working well before trying it. They are a big part of making a product popular.
- Late Majority: This group is more doubtful. They adopt new tech only after most other people have already done so and feel pressured to catch up.
- Laggards: These people are the very last to try new things. They prefer old ways and are often suspicious of change.
This model helps us see how a tech adoption curve starts with just a few users and then grows into a widespread trend. Other classic models, like the Technology Acceptance Model (TAM), also look at why people choose to use new tech. They focus on how useful and easy a new tool is to use Innovation Adoption Models and Constructs.
Modern Twists on Adoption
But in 2026, the world of applied tech is changing very fast. We need to think about how modern technology, especially AI, works differently. Today’s tech adoption curve is also shaped by:
- Platform Effects: Think about how quickly apps on a popular mobile store or tools built into a big social media site can spread. When a new tech uses an existing platform, it can reach millions of people almost overnight.
- Network Effects: This means the more people who use a tech, the more valuable it becomes for everyone. Social media apps are a great example: if your friends join, you are more likely to join, making the app stronger for all users. This speeds up adoption much more than older products.
- AI-Specific Dynamics: AI tools can learn and get better as more people use them. This makes them more helpful over time, which draws in even more users. This rapid improvement in areas like personalization and efficiency changes how quickly people get used to and deeply use new tech. This is especially true for cutting-edge impact tech.
These new factors mean that the speed of adoption, how much people actually use a product, and how companies make money from it can be very different. For some tech, like certain impact tech for good, adoption might be slower but deeper, focused on solving big problems. For others, like a new consumer feature, adoption might be very fast but perhaps not as deep.
These differences also change how founders raise money. Investors look for different signs depending on the type of tech. For instance, a company with strong network effects might attract investors earlier because they see the potential for fast, wide growth. A deep tech company, on the other hand, might need more time to show traction but could get funding for its long-term impact and innovation. Founders who understand the latest Technology Definition 2026 can better explain their innovations. They can also use Tech Tools for Startups 2026 That Attract Investors and Accelerate Fundraising to stand out.
After understanding the different ways new technology spreads, the next step is to look for clear signs in the market. These signs tell us exactly where a product sits on the journey from being a brand-new idea to something many people use. For anyone working with applied tech, knowing these signals helps you plan better and even attract investors.
Let’s look at the key market signals:
Operational Signals: How Users Interact
Operational signals show us how people actually use the tech.
They help us tell if a product is still only used by a few "early adopters" or if it’s catching on with the "early majority."
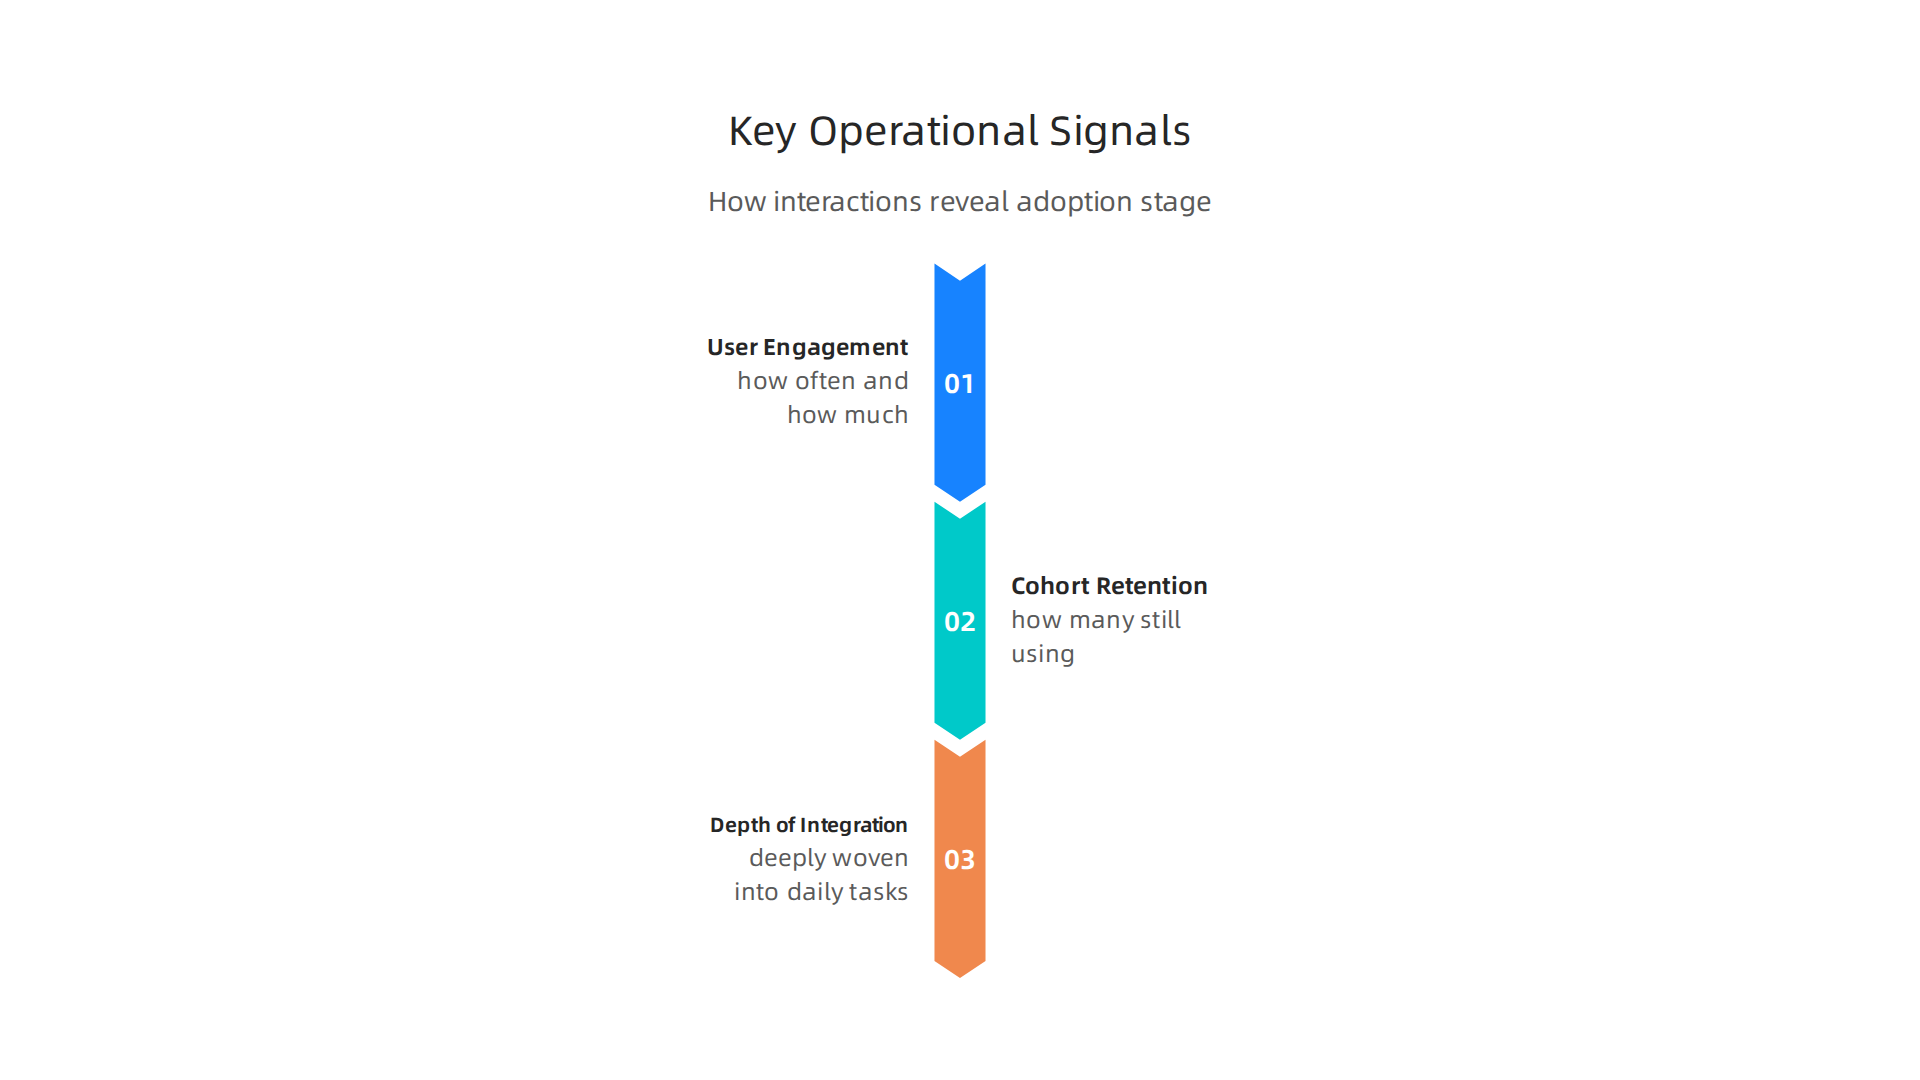
- User Engagement Patterns: This means how often and how much people use the product. Are users logging in every day, or just once a month? Do they use all the features, or only a small part? High and regular engagement shows that the product is becoming important in users’ lives. For example, AI agents are now common, with 80% of business apps having at least one AI agent embedded in Q1 2026, showing deep integration
AI Agent Adoption 2026: 120+ Enterprise Data Points. This kind of deep usage is a strong sign of movement along the tech adoption curve.
- Cohort Retention: Imagine a group of users who started using your product at the same time. How many of them are still using it months later? Good retention means people find lasting value, which is key for moving from niche usage to widespread adoption. If many users keep coming back, it means the product truly helps them.
- Depth of Integration: Is the tech just a fun extra, or is it deeply woven into people’s daily tasks or business processes? For example, if a new applied tech helps a company do its main work, it’s more deeply integrated than a tool they use only sometimes. As of 2026, about 87% of marketers use generative AI in their work, showing how deeply AI is becoming part of many jobs Marketing AI Adoption Statistics (2026): 56+ Data Points on …. This signals strong, real-world adoption.
These signals help companies understand if their product is genuinely useful and becoming a must-have, rather than just a nice-to-have. Understanding these patterns is crucial for mapping the tech domain for future success. Learn more about mapping the tech domain for founder and investor success.
Commercial Signals: How Money and Business Flow
Commercial signals look at how the product is sold and bought. These change as a product moves through the different stages of the tech adoption curve.
- Pricing Elasticity: At first, new tech can be expensive, and only a few will pay for it. But as more people adopt it, the price might need to become more flexible. If a product can lower its price and still attract many new users, it means it’s ready for a bigger market. If small price changes scare away many buyers, it might still be in the early, niche stages.
- Channel Adoption: How a product is sold changes with its adoption stage. Early on, a company might sell directly to customers. But for wider adoption, it might need to partner with larger stores, online platforms, or other businesses. For impact tech, this could mean working with government agencies or non-profit groups to reach more people.
- Enterprise Procurement Cycles: For businesses, buying new tech can be a long process. As a product moves towards widespread business adoption, the buying process often becomes smoother and faster. This means companies trust the product more and see its clear value. By 2026, many companies plan to use AI agents from trusted vendors, with 72% intending to deploy them, indicating clearer paths for enterprise procurement AI Agents Statistics 2026: Market Data, Adoption and ROI. This shift shows that a tech is moving from an experimental phase to becoming a standard business tool.
Keeping an eye on these operational and commercial signals helps founders, investors, and even everyday users see the true path of a product on the tech adoption curve. Knowing these signs helps you make better decisions about where to put your time and money.
For founders and investors alike, staying on top of the latest advancements in AI and technology is essential.
The Deep View Newsletter offers comprehensive daily insights. The AI Newsletter Worth Reading
Investor behavior across the adoption curve: what VCs and angels actually fund
Now that we know how to spot the market signals, let’s look at how investors like venture capitalists (VCs) and angel investors think about these signals. Their funding choices depend a lot on where a technology sits on the tech adoption curve. They want to know how risky an investment is and what kind of return they can expect.
Investor Risk and What They Look For
Different kinds of investors are okay with different levels of risk.
- Early Stages (Innovators and Early Adopters): When a new applied tech is just starting out, it’s very risky. There’s not much proof that people will actually use it or pay for it. At this stage, angel investors and small venture capital firms are often the ones who step in. They are willing to take big risks for the chance of very big rewards. They look for strong ideas, a passionate team, and a clear plan. They might fund a startup with just a basic product (called an MVP) and a few test users. The company’s value might not be very high yet because it’s so early. For example, AI adoption from 2024 to 2026 moved through phases of experimentation before formal adoption, showing how early tech needs time to prove itself AI Adoption Trends: 2024-2026 Data.
- Later Stages (Early and Late Majority): As a technology moves into these stages, it becomes less risky. More people are using it, and there’s clear proof it works and has a market. Here, bigger VC firms and private equity groups often get involved. They look for companies with lots of users, steady growth, and a clear way to make money. They expect to see things like many paying customers and a proven plan for the future. Companies at this stage have much higher values because they are more stable.
How Funding Groups and Money Change
The groups of investors (syndicates) and the amount of money they put in (check sizing) also change as a technology gains more users on the tech adoption curve.
- Seed Funding (Very Early): Usually, a few angel investors or very early-stage VCs will put in smaller amounts of money. They are helping a startup get its first product off the ground. If you’re looking for early capital, understanding how to raise it is key for seed enterprise investment in 2026 data driven strategies to raise capital.
- Growth Funding (Later Stages): As a company grows and shows strong results, larger VC firms and sometimes even private equity companies come in. They invest much bigger amounts of money to help the company grow even faster, reach more customers, or expand into new areas. For impact tech, which aims to solve big problems, this later-stage funding can help them scale their solutions to help many more people.
Understanding these investor behaviors helps founders know when and how to approach different types of investors, making their fundraising journey smoother. It also helps investors make smart choices about where to put their money.
To attract those investors and grow your business, founders need to track the right numbers. It’s like having a map for your journey and showing everyone how far you’ve come. Founders need to use market datasets, survey signals, and benchmarks to prove their applied tech is gaining real traction on the tech adoption curve.

Market datasets, survey signals and benchmarks founders should track
Founders should focus on a small but important group of numbers. These numbers help them see if people are really using their product and moving along the tech adoption curve.
- Activation: This is about how many people start using your product after signing up. Are they taking that first important step?
- Retention: Are people coming back to use your product often? If they stick around, it shows your product is valuable.
- Expansion: Are users using more features or buying more from you? This means they like your product so much they want to do more with it.
- Procurement Signals: For businesses, this means watching when they decide to buy or sign up for your service. These signals show that your solution is becoming a must-have.
Tracking these points helps founders understand where their product stands on the product adoption in 2026 journey. It’s also important for founders to properly master framing tech for startup fundraising success by presenting these numbers clearly.
Combining Different Data Types
To get a full picture, founders need to mix different kinds of information.
- Public Datasets: This includes big market reports or studies that show general trends in applied tech. For example, if you’re building an AI product, there are many guides like the AI-Native Startup Playbook Launch that can give you insights into broader trends in 2026. This helps you see how your specific tech fits into the bigger picture of the market. Knowing how to map the tech domain for founder and investor success 2026 is part of this.
- Your Own Data: This is called proprietary telemetry. It’s the data you collect directly from your product, like how many users log in, what features they click, and how long they stay. Tools for improving how to increase product adoption in SaaS (2026 Guide) can help you gather and understand this data.
- Talking to Customers: Surveys and interviews are super important. They tell you why people use your product or why they don’t. This human feedback is priceless.
Creating a Coherent Benchmark
Once you have all this data, you can create a benchmark. This means setting a standard for what good looks like for your startup. You compare your numbers to what other similar companies are doing, or even to your own past performance. This helps you see if you’re on track to move your applied tech further along the tech adoption curve. For example, understanding AI Adoption Strategies: Your 2026 Playbook can help you benchmark your own AI initiatives against industry best practices. This full view helps you make better choices and show investors how your product is growing.
Staying updated on the latest shifts in technology, especially AI, is key for founders. If you want to keep up with these fast changes, consider getting The AI Newsletter Worth Reading. It gives clear daily AI updates.
To keep growing and show investors your applied tech is truly making an impact, you need more than just numbers. You need a plan to move from those first enthusiastic users, called early adopters, to a much bigger group, the early majority. This shift is a big part of climbing the tech adoption curve.
Here are some key actions founders can take:
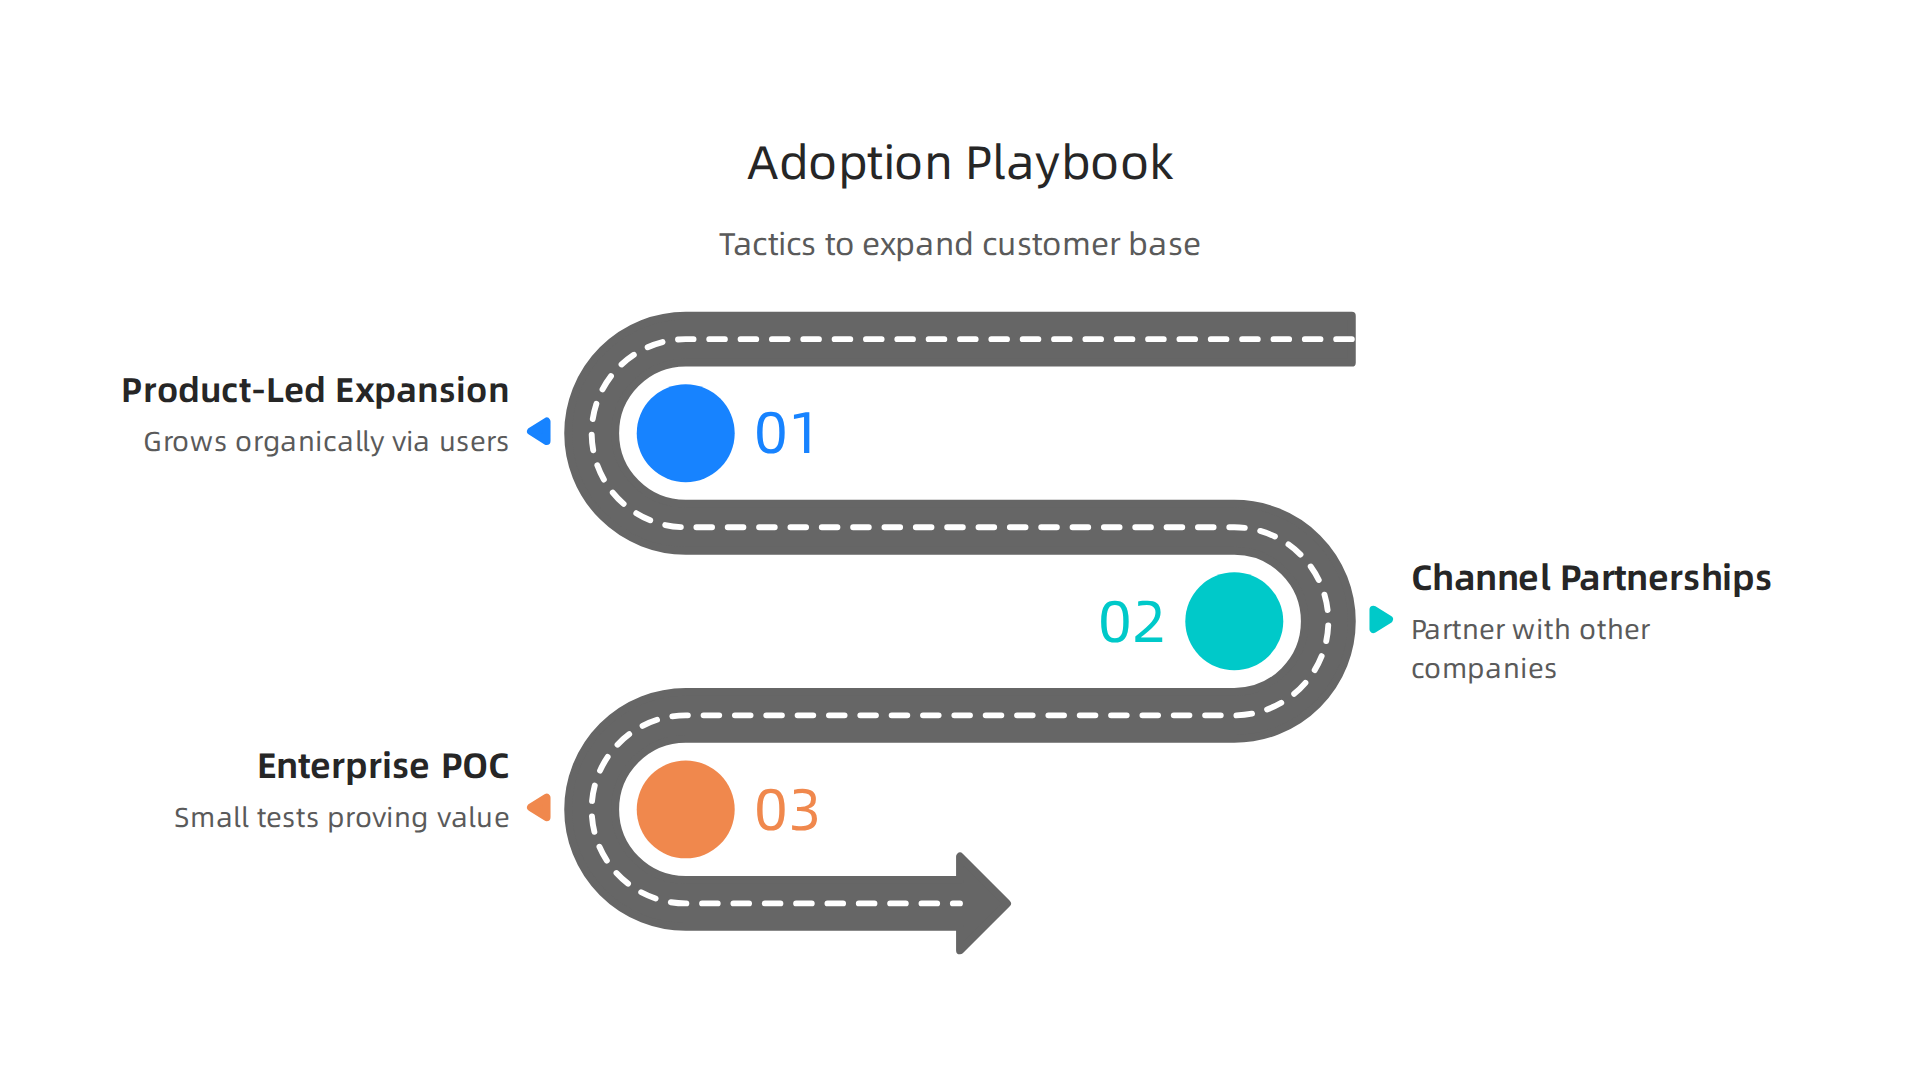
Operational Playbook Items Founders Can Test
- Product-Led Expansion: This means making your product so good that it grows on its own. Users love it, use more of it, and tell others. Think about adding new features that naturally get people to use the product in new ways or encourage them to upgrade. For businesses, this might mean making it easy to add more users or connect with other tools they already use.
- Channel Partnerships: Working with other companies can help you reach many more customers. Imagine your applied tech product working with a bigger company’s service. This partnership lets you tap into their existing customer base, speeding up your growth and moving more people onto your tech adoption curve. Understanding how corporate venture capital is the new power broker in startup funding can help you find suitable partners.
- Enterprise Proof-of-Concept (POC) Structuring: When you want big companies to use your product, you often start with a "proof-of-concept." This is a small test to show them exactly how your product solves their problems. It needs to be clear, show real results, and be easy for them to try. Crafting good case studies is very helpful for this, as they can act as a way to boost product adoption, according to experts in the field Using case studies as a catalyst for product adoption.
Go-to-Market Adaptations
As you reach more people, you’ll need to change how you talk about and sell your product.
- Messaging Shifts: What excited early adopters might not work for the early majority. You need to adjust your message to focus on broader benefits and how your product makes everyday life or work easier, not just the cool new features. It’s about showing the solid value your product brings.
- Pricing Experiments: The right price can change as your customer base grows. You might try different pricing plans to see what encourages more people from the early majority to sign up. This could mean offering simpler plans, more flexible options, or even free trials that lead to paid use.
- Support Model Changes: When you have a small group of users, you can offer very personal support. But for the early majority, you need a support system that can handle many more people. This might mean building better help guides, setting up online forums, or using chatbots to answer common questions quickly. These changes help your company scale and ensures everyone can easily use your solution.
To keep growing your applied tech business, showing investors how your product will be used by many people and bring in money is super important. This is called forecasting. You need to tell a clear story with numbers about how you expect your tech adoption curve to climb.
How to Forecast Adoption and Money
There are two main ways to guess what will happen in the future for your business:
-
Using Numbers (Quantitative Forecasting): This is when you look at facts and past data to make smart guesses about the future. You might look at how fast similar products grew, how many people are in your target market, or how your own product has grown so far. For example, if your applied tech helps businesses, you can look at how many businesses need your solution. This kind of planning helps you show how your product’s use will spread and how much money it will make. Experts say that mixing these number-based methods with smart ideas from people who know a lot about the field gives the best forecasts for future tech trends in 2026. This mix helps you see the full picture better than using just one type of information Future tech forecasting guide: predict trends in 2026.
-
Thinking About "What If" (Scenario-Based Forecasting): Sometimes, things don’t go as planned. So, it’s smart to think about different futures. What if your product grows super fast? What if it grows slower? What if a new competitor shows up? This is called scenario planning. It means creating different possible stories for what could happen to your business. For each story, you figure out how your adoption and money might change. This helps you get ready for anything. A typical way to do scenario planning involves figuring out what could happen, finding trends, and then designing different situations to test your plans Scenario planning: strategies, techniques, & examples [2026]. This shows investors that you’ve thought about different outcomes and have a plan for each. To make good choices, staying up-to-date with general market and tech knowledge is key, as covered in our guide to global tech intelligence for startup fundraising success.
Making Your Fundraising Plans Strong
After you make your forecasts, you need to "stress-test" your plans. This means checking if your fundraising goals still make sense even if things don’t go perfectly. For example, if you hope to raise $5 million, what if your product’s adoption is 20% slower than you thought? Or what if it takes three extra months to reach certain milestones? By asking these tough questions and planning for them, you show investors that your plans are strong and realistic, no matter what happens. This careful planning helps build trust and makes your startup more attractive to people who want to invest.
Staying informed about the latest in applied tech and impact tech can also help you refine your forecasts and adapt your strategies.
Want to stay ahead of the curve in AI and technology, which directly impacts forecasting models and market trends? Get clear daily AI updates from The AI Newsletter Worth Reading.
Investors want to see that your applied tech business can grow a lot and keep growing. They don’t just look at your numbers; they also check for special signs that mean your company is strong and will last. These signs help them see if your product will really make it big along the tech adoption curve. Knowing what investors look for can help you show your company in the best light.
What Investors Look For
When investors decide where to put their money, they have a checklist. They want to find companies with durable opportunities, meaning they can succeed for a long time.
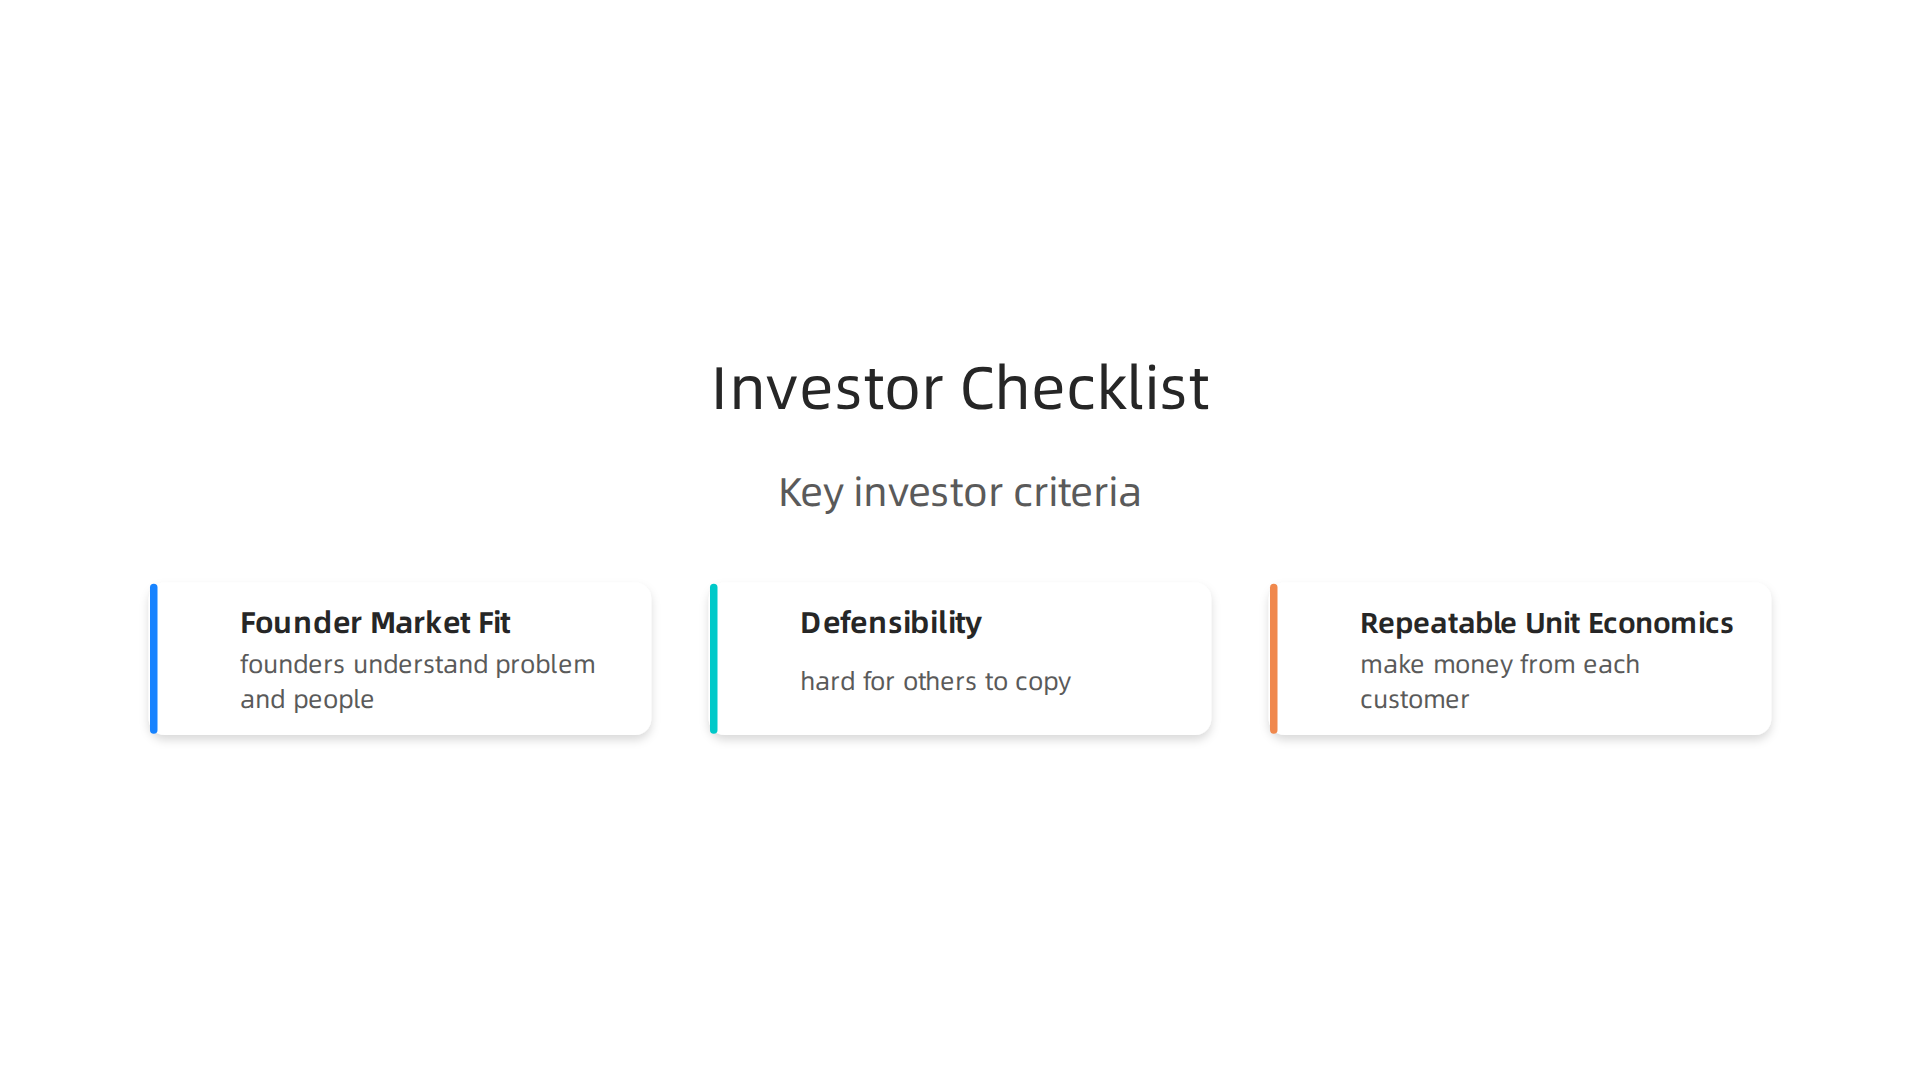
- Founder-Market Fit: This means that the people who started the company (the founders) really understand the problem they are solving and the people they are helping. They have the right skills and passion for their market. It’s like having the perfect key for a specific lock.
- Defensibility: This is about what makes your applied tech special and hard for others to copy.
- Network Effects: This happens when more people using your product makes it better for everyone. Think of social media: it’s more useful when all your friends are on it. This makes it hard for a new competitor to catch up.
- Data Moats: A "data moat" means your product gets smarter and better the more data it collects. This makes it very hard for others to compete because they don’t have your unique and growing pool of information.
- Repeatable Unit Economics: This big phrase just means you can make money from each customer you get, and you can keep doing it over and over again without spending too much. Investors want to know that for every new user, you’ll make more money than it cost you to get them. This shows a clear path to profit. Keeping up with what’s new in the world of technology, like the Technology trends 2026: 7 trends shaping the future of IT, helps investors see if your tech fits into big market shifts.
Red Flags for Investors
Just like there are good signs, there are also things that make investors worried. These are "red flags" that might mean a technology is risky or won’t grow as expected on the tech adoption curve.
- No Clear Problem Solved: If your applied tech doesn’t fix a real, painful problem for people or businesses, it might not find many users. Investors want to see that your solution is truly needed.
- High Cost to Get Customers: If it costs you a lot of money to get each new customer, it will be hard to make a profit. This is a big concern for investors.
- Easy to Copy: If your product is too easy for other companies to copy, it won’t be unique for long. Investors prefer businesses with strong walls around their ideas, like those network effects or data moats mentioned before.
- Market Is Too Small: Even if your product is great, if only a few people need it, it won’t grow enough to make investors happy. They look for big markets.
- Slow Adoption or High Churn: If people try your product but don’t stick with it, or if new users are coming on board very slowly, it signals that your tech isn’t catching on. This is a clear risk for any investment in impact tech or other new solutions.
Summary
This article explains why the tech adoption curve matters to founders, operators, and investors in 2026 and shows how to use it to make smarter product, go-to-market, and fundraising decisions. It reviews classic models like Rogers’ diffusion theory and modern twists driven by platform effects, network effects, and AI dynamics that accelerate or deepen adoption. The piece breaks adoption signals into operational (engagement, retention, integration) and commercial (pricing elasticity, channel adoption, procurement cycles) indicators, then maps how different investors behave across stages—from angels at seed to larger VCs and private equity later. Founders get a concise list of the metrics to track (activation, retention, expansion, procurement), practical playbook items (product-led growth, channel partnerships, POCs), and guidance on forecasting using quantitative and scenario-based approaches. Finally, the article outlines what investors look for—founder-market fit, defensibility, repeatable economics—and the common red flags that hurt fundraising prospects.